
Own the base, rent the spike
Maintain complete control over your environment with top-tier, single-tenant, dedicated servers. Higher performance, ultimate security and lower cost than the major clouds can offer!
Get Started
Own the base, rent the spike
High performance without high cloud costs

Predictable monthly pricing (no egress)
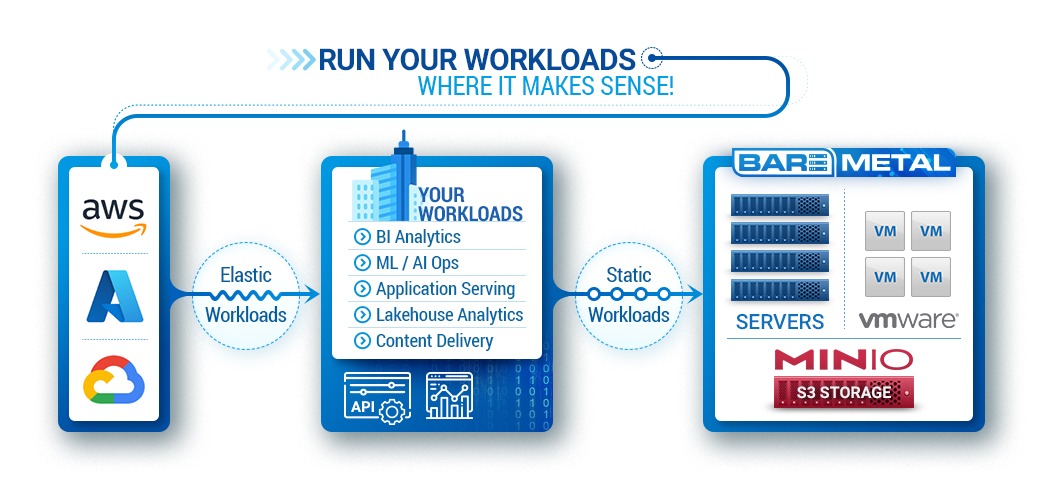
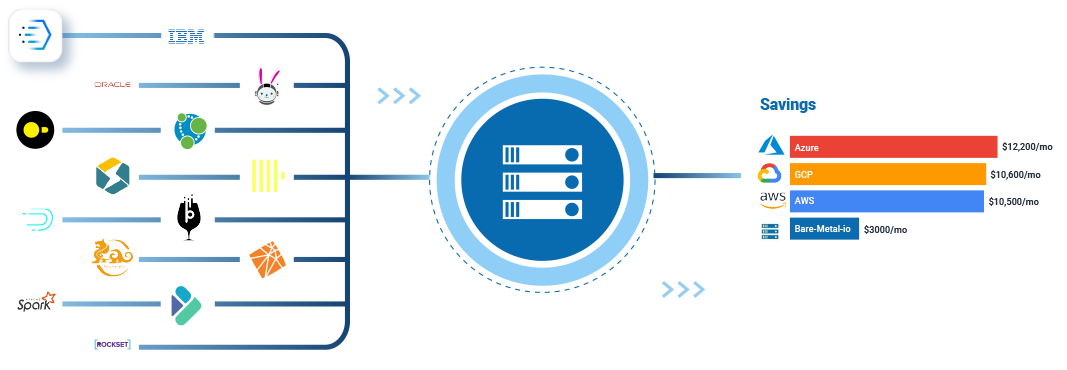
The major clouds are great for scaling and elasticity when you need it. Bare-Metal.io lets you “own the base, rent the spike” , providing cost-effective, dedicated infrastructure for steady workloads while relying on the cloud for scaling to handle peak demands.
Read the: ClickHouse Benchmark – AWS bare metal vs. Bare-Metal.io
Intentionally straightforward to give you the highest cost savings. View pricing >
Starting at
$1000 / mo
Starting at
$2800 / mo
Starting at
$4000 / mo
Starting at
$1500 / mo
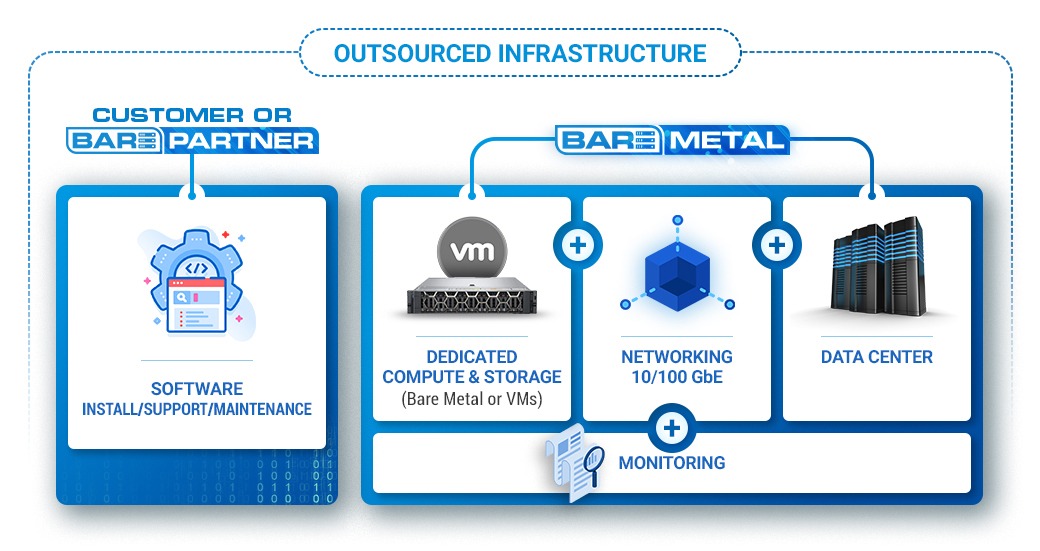
Bare-metal.io takes care of compute, storage, networking, monitoring, and data center management, while you or our partners focus on software installation, support, and maintenance, creating a seamless, cost savings and efficient solution.
We’ve seen an explosion in the demand for bare-metal servers. These servers are used to power a variety of big data applications and our customers do not want a virtualization layer in the middle slowing things down. We started bare-metal.io to focus on large, high performing servers to meet the demand for the explosion of data and the need for real-time analytics/detection for this data.
Ready to get started? Reach out to our team and we’ll be in touch.